2014年9月22日星期一

Modeling Friction Forces

In this lab, we study about friction of object and figure out coefficient of static friction. And we built 4 different model about friction of object.

1.Put a wooden black on the table, tie a string to the block and connect to water cup over a pulley at the end of the track.And then, we put water to the cup patiently until the block finally starts to slide to edge of table.Record the mass of the cup and water required to get block to start to move.And we add 3 times wooden block and record them to record their mass of wooden block and mass of water.
 The record :

After this, we plug all data into computer to create the graph:

So that, we can the coefficient of static friction between table and block is 
0.2188.

2.drag the block in constant speed by motion sensor which is connected to the block, and we get the graph from Labpro:
And this graph gives us the average kinetic friction force between the block and the track.
After we measure those blocks' mass, we create the table to record mass of block and normal force.
      mass(kg)      normal force(N)   friction(N)
  1.  0.11          1.078              0.3177
  2.  0.236         2.3131             0.6187
  3.  0.295         2.89               0.852
  4.  0.45          4.411              1.3
we model sliding friction as being proportional to the normal force, and speed of the moving object. That is, we create a function:
Fkinetic=K*N=>K=Fkinetic/N
we get the number K is 0.2947. 

3.We make a slope with the metal track and put the motion sensor at the bottom of the track, and then let a wooden block to slide down to bottom from top.And we can record the acceleration with computer and sensor, show in picture:
from this graph, we are able to apply the equation to get net force:
and the net force is equal to sin(a)*mg-Ffriction so we can get:
=>
divide the m
=>
the a=0.8527m/s^2,angle a=20degrees, so we get k=0.2807


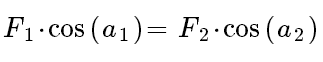
4.we make a slope, connect the block which is on slope to a mass over pulley, and make the angle between slope and horizontal table to be just make the mass can drag the block to move.
And now, we know the mass is 0.15kg,angle is 21.5degree,block is 160kg, and acceleration is 0.545m/s^2 with measuring.
we create a equation:

and we can get k is 0.5539


2014年9月16日星期二

measure density of metal

In this lab, our goal is figuring out the uncertainty of values.
In the first part, we were going to measure 3 different metals' length, diameter, and mass in order to get the density with its uncertainty.
And then, we get:
    metal         length        diameter         mass            density
  1. steel      5.00+-0.01 cm  1.26+-0.01 cm  48.9+=0.1 g      7.6 g/cm^3
  2. copper     5.14+-0.01 cm  1.28+-0.01 cm  58.4+=0.1 g      8.8 g/cm^3
  3. brass      4.80+-0.01 cm  1.60+-0.01 cm   80.0+=0.1 g     8.3 g/cm^3

From the equation for density:
And then, we take the natural logarithm of each side we get:
=>
  1. steel 
  2. copper
  3. brass


This,we can get those metals' density with their uncertainty:

  1. steel:  7.6+-0.15 g/cm^3
  2. copper: 8.8+-0.16 g/cm^3
  3. brass:  8.3+-0.12 g/cm^3
And, there is next lab to determine the mass of object by measuring two angles and those forces of two strings.
All of first, we focus on the y size of the object.
and then, we focus on the x size of the object.

The data we measure about force on strings and angles:
F1=7.5+-0.5N
F2=7.0+-0.5N
a1=46degree+-1degree
a2=50degree+-1degree
plug those data to equation.
And we can get the force from equation

is 1.0976+-0.015N


2014年9月12日星期五

Lab 4 Trajectories

In this lab, we were going to predict the impact point of a ball on an inclined board with our understanding of projectile motion.So we need to set up a model to make the ball launching in same direction and speed.
As what picture shows:
And then, we need to tape a carbon paper to the floor about where the ball landed. After this, we launched the ball five times from the same high as before and verify that the ball lands in virtually the same place each time.
Now, because we need to calculate the velocity of the ball, when the ball launches, we need to measure the height of the ball falling, the distance of the ball lands from the table's edge.
With hanging a plumb bob, we also get:
the height of the bottom of the ball when it launches: 0.94 m
the distance of where the ball lands from the table's edge: 0.755 m
=>velocity:
we already known the distance, but we did not the time it falling.
Thus,  from
Vo= 0 m/s, g= -9.8 m/s^2 =>
=>


And,we plug the time and distance into equation:
In this lab, our goal is predicting the impact point of ball on an inclined board. And we have known the Vo and angle of the inclined board.
For predicting impact, we had to create two equation to describe the path of falling ball and the inclined board.
Falling ball:


inclined board:
After solving this two function, we can predict the point (x,y) where the ball will impact the board.And we can get the distance

In experiment, we place a board so that it touched the end of table and floor, and attach a piece of carbon paper to where the ball may impact to board. Finally, find the point and measure the distance, and we found the theoretical value for d is bigger than experimental one, but they are almost same.

2014年9月11日星期四

Modeling the fall of an object falling with air resistance

Modeling the fall of an object falling with air resistance

Today, we went to find the equation about the speed and the force of resistance.
There is an expectation that air resistance force on a particular object depends on the object's speed:
And we need to determine the k and n so that we can complete the equation. Therefore, first step is taking the natural logarithm of each side we get:
And then, we need to collect the data about the F and v, so we did this in the Design Technology building and to use video capture.
and then, we can:
  1. m=5*1.035 g,v=2.525 m/s
  2. m=4*1.035 g,v=2.129 m/s
  3. m=3*1.035 g,v=1.641 m/s
  4. m=2*1.035 g,v=1.272 m/s
  5. m=1*1.035 g,v=0.922 m/s

Because we already know the net force :
=>

When the velocity did not changed and be constant, the a =0.
=>
=>


=>
And then,we use the computer to get terminal velocities for each one by fitting the linear portion of the position vs time graph.
Therefore, we get n= 1.39, k=0.0142.
After that, we use Excel to model the fall of an object with air resistance.
we can find the a is close to 0, we can see the velocity at that moment. In additional, we can compare the our calculated graphs with our measured graph. And they are almost same.

2014年9月10日星期三

Non-Constant acceleration problem/activity

Before this lab, we usually did some problem about constant acceleration, but, now, we were going to handle those problem on non-constant acceleration, and use program in computer to solve other same style problem.
Here is the question:
A 5000-kg elephant on friction less roller skates is going 25 m/s when it gets to the bottom of a
hill and arrives on level ground. At that point a rocket mounted on the elephant’s back generates a constant 8000 N thrust opposite the elephant’s direction of motion.The mass of the rocket changes with time (due to burning the fuel at a rate of 20 kg/s) so that the m(t) = 1500 kg – 20 kg/s·t.
Find how fat the elephant goes before coming to rest.

For solve this question, in the first step, we need to find the equation about the acceleration of the elephant + rocket system with Newton's second law:

Second step, we can integrate the acceleration from 0 to t find the instant velocity and then derive the equation for v(t):


and we get:
Third step, we continued to integrate the velocity from 0 to t to find changed position and then derive the equation for x(t):

Therefore we can get:
And then solve v(t) to find the time at which v=0.After we got the time, and we can lug it into the expression for x(t) to find how far that elephant goes, and we got: 249m.
After we solved the problem, we can use Excel to solve other same style problem.

We created a row of time which incremented by 0.1 seconds for at least 220 rows. We would calculate the acceleration at any time in column B, and input the formula into cell B3. In column C, we calculated the average acceleration. In column D, we calculated the change in velocity. In column F, we calculated the speed.

Conclusion:
1. They are almost same between two results from doing problem analytically and doing it numerically.
2. The way you wanted to know whether the time interval is close enough to get a good result you could try to change the interval of seconds on the first table and watch how much the distance was changes. If we did it several times and noticed the answer did not change, we could assume the time interval is well.


2014年9月3日星期三

Free Fall Lab---determination of g

This is my second lab about determining of g.For making the lab to be successful, our purpose was collecting the data about the position of the object and time, and we can analyse those data to figure out the acceleration of the object so that we can get the g.
The first step, we prepared the apparatus:
1.a ruler: to measure the position
2.a free-fall body: to be object
3.heavy tripod base with leveling screws
4.tape and spark generator: to point the position of the object each time
5.power support
6.computer: to calculate the data
So, after we finished preparation, we collection the position data about when object was falling.As the picture:
During the object was falling, the spark generator would spark a black point on the tape. And we measured the positions about those points by ruler.

One by one, we typed the positions data into computer and marked the ordered time.And we could use the computer to find the those distance between points by excel.
We created 5 columns like time, distance, position. mid-interval time, and mid-interval speed as the picture shows. Using the tool in excel, we got the data in short time.
Second step, we created a new sheet and made a new liner picture to record the situation of the object about distance and time, and then fixed it correctly.
After all, we should got the acceleration about falling object, so we created another sheet and made a chart about the Mid-interval speed and Mid- interval time. And we also fixing it, and the slope will be the g we want to get.

And then, we got the g is 953.
For making the research deeper, we got the g from other groups, and created a new chart for errors and uncertainty. We made a column to collect the g and we calculate the average. And then, we created two columns about average deviation standard deviation of the mean.