As the picture shows, we set the spring holding a mass. The motion sensor was below the mass for measuring the velocity and the position of the mass. The force sensor hold the spring for measuring the elastic coefficient.

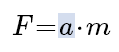
- Kinetic Energy
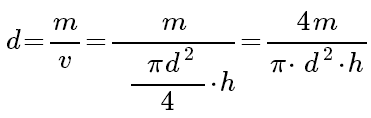
- Static Energy
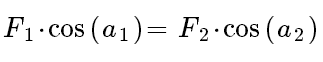
- Elastic Potential Energy
First of all, we need to know the kinetic energy of the mass. We apply the equation with mass and velocity:


And then, we need the static energy and apply the equation with the velocity and mass:
At the last one, we also need to know the elastic potential energy and apply the equation:
However, we still did not know the elastic coefficient k. Thus, we measured the position of the non-stretched mass and the force applying to the force censor And then, we added some mass to the spring so that the spring could be stretched longer, and we measured the new position and the new force applying to the force censor. Therefore, we could use this equation to get k.
And we can use this to find the elastic potential energy. And then, we make a table to record the number and a graph to show how they changing. For readability, we make a parameter for total energy.
From those pictures,we could discover that the total energy was a constant even though it was not perfect, so we can say the even though the energy always change, the total energy is unchangeable except there is another object applies work on it.